If you’re a baseball fan or just getting into the game, you might have heard the term WHIP thrown around when discussing pitchers. But what exactly is WHIP, and how is it calculated?
Understanding this key statistic can give you deeper insight into a pitcher’s performance and help you appreciate the game on a whole new level. You’ll discover the simple formula behind WHIP, why it matters, and how to interpret the numbers to see which pitchers are truly dominating on the mound.
Ready to unlock the secrets of WHIP and take your baseball knowledge up a notch? Keep reading!

Credit: anexas.net
Basics Of Whip
WHIP stands for Walks plus Hits per Inning Pitched. It is a key baseball statistic that shows how many baserunners a pitcher allows. This helps measure a pitcher’s effectiveness in preventing opponents from reaching base. Understanding WHIP gives insight into pitching performance beyond just wins and losses.
WHIP is simple to calculate. You add the total walks and hits a pitcher allows. Then, divide that number by the total innings pitched. This ratio reflects how many runners reach base each inning. The lower the WHIP, the better the pitcher controls the game.
What Whip Represents
WHIP represents a pitcher’s ability to limit baserunners. It counts only walks and hits, ignoring errors or hit-by-pitches. This focuses on the pitcher’s direct control over the game. A low WHIP means fewer runners get on base, reducing scoring chances for the opposing team.
Importance In Baseball
WHIP is important because it reveals a pitcher’s consistency. It shows how often a pitcher allows opponents to reach base. This statistic helps compare pitchers fairly, regardless of team defense quality. Coaches, analysts, and fans use WHIP to evaluate and predict pitching success.

Credit: www.wikihow.com
Whip Calculation
WHIP is a key baseball stat that shows how many baserunners a pitcher allows per inning. It helps measure a pitcher’s control and effectiveness. Calculating WHIP involves a simple formula. Understanding this formula helps fans and analysts see how well a pitcher limits opponents’ chances to score.
Formula Breakdown
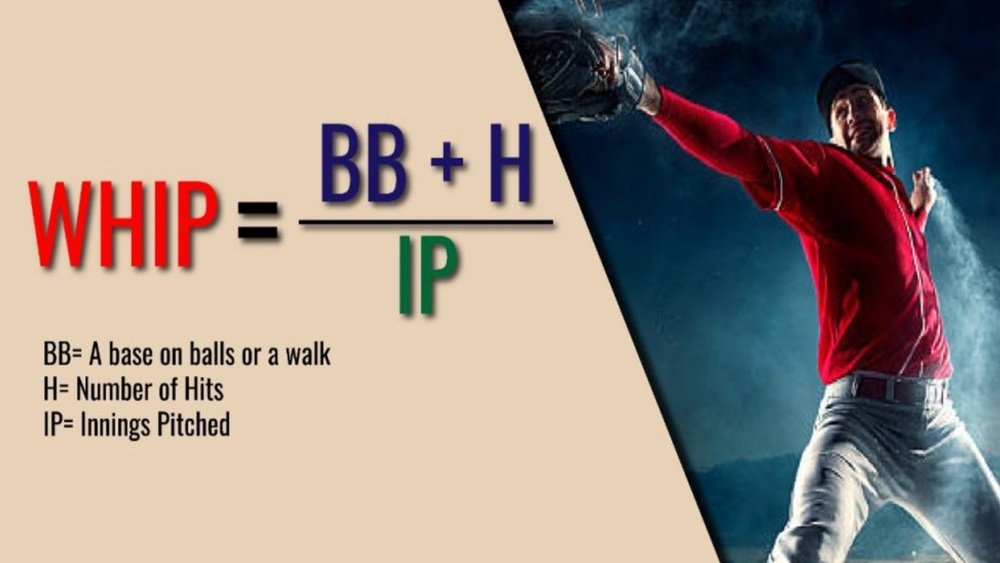
The WHIP formula is straightforward. You add the total walks and hits allowed by a pitcher. Then, you divide that number by the innings pitched. This gives the average number of baserunners allowed per inning. The formula looks like this:
WHIP = (Walks + Hits) ÷ Innings Pitched
A lower WHIP means fewer baserunners, showing better pitching.
Walks And Hits Explained
Walks are when a pitcher allows a batter to reach first base by throwing four balls. Hits happen when a batter safely reaches a base after hitting the ball. Both walks and hits increase the number of baserunners. These stats reflect how well a pitcher controls the game and prevents scoring chances.
Innings Pitched Role
Innings pitched is the total number of innings a pitcher has thrown. It counts full and partial innings. This number shows how much time the pitcher spent on the mound. Dividing walks and hits by innings pitched normalizes the stat. It allows fair comparison between pitchers with different workloads.
Interpreting Whip Numbers
Understanding WHIP numbers helps evaluate a pitcher’s ability to control the game. WHIP stands for Walks plus Hits per Inning Pitched. It shows how many baserunners a pitcher allows on average each inning. A lower WHIP means fewer runners reach base, which usually leads to fewer runs scored against the pitcher. Interpreting these numbers allows fans and analysts to compare pitchers effectively and appreciate their skill levels.
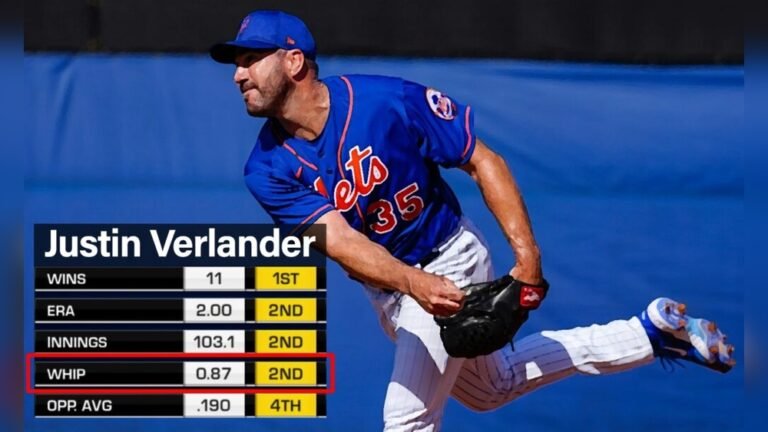
What Is A Good Whip
A good WHIP is generally below 1.30 in most leagues. Top pitchers often maintain a WHIP under 1.10. This means they allow just over one baserunner per inning. A WHIP near or above 1.50 suggests the pitcher struggles to control hitters. Teams prefer pitchers with low WHIP as they limit scoring chances. WHIP gives a quick snapshot of a pitcher’s effectiveness beyond just wins or strikeouts.
Comparing Whip Among Pitchers
Comparing WHIP helps identify the best pitchers on a team or in a league. It accounts for walks and hits, showing how often pitchers let runners on base. Some pitchers may have high strikeouts but also high WHIP, indicating inconsistency. Others keep runners off base steadily, making them reliable. WHIP comparison helps coaches decide pitching roles and fans understand pitcher impact.
Historical Whip Records
The lowest career WHIP in Major League Baseball history is under 0.97. This record belongs to pitchers known for exceptional control and skill. Over decades, the average WHIP has shifted with changes in the game. Comparing current pitchers to historical records provides context about their performance. It shows how rare top-level control and dominance can be in baseball.
Whip In Player Analysis
WHIP stands for Walks plus Hits per Inning Pitched. It is a simple and clear way to analyze a pitcher’s ability. This stat shows how many baserunners a pitcher allows on average each inning. A lower WHIP means the pitcher lets fewer players reach base, which is usually better. WHIP helps fans and coaches understand a pitcher’s control and effectiveness.
Using Whip For Performance Evaluation
WHIP gives a quick look at a pitcher’s control and defense. It shows how often batters reach base by walk or hit. Coaches use WHIP to compare pitchers and identify strengths or weaknesses. A pitcher with a low WHIP usually keeps the opposing team from scoring easily. This stat works well over a full season to judge consistency.
Limitations Of Whip
WHIP does not consider how many runs a pitcher allows. It ignores the quality of hits, such as singles versus home runs. WHIP also does not account for errors or fielding help from teammates. Pitchers with high strikeout rates may have similar WHIP to others but be more dominant. Using WHIP alone gives an incomplete picture of pitching skill.
Complementary Stats To Use
To get a fuller view, use WHIP with ERA and strikeout rates. ERA shows how many runs a pitcher allows per nine innings. Strikeout rate reveals how often a pitcher retires batters without contact. Combining these stats helps measure control, dominance, and run prevention. This approach gives a balanced view of a pitcher’s performance.
Calculating Whip Manually And Digitally
Calculating WHIP manually and digitally offers two easy ways to understand a pitcher’s performance. WHIP stands for Walks plus Hits per Inning Pitched. It shows how many baserunners a pitcher allows on average each inning.
Knowing how to calculate WHIP helps fans and analysts compare pitchers effectively. Manual calculation uses simple math, while digital tools provide quick results. Both methods have their advantages and common pitfalls to watch out for.
Step-by-step Manual Calculation
First, find the total walks allowed by the pitcher. Then, add the total hits given up. Next, note the total innings pitched. Use the formula: WHIP = (Walks + Hits) ÷ Innings Pitched. Divide the sum of walks and hits by innings pitched. The result is the WHIP number. A lower WHIP means fewer baserunners allowed per inning.
Using Online Whip Calculators
Online calculators simplify the process. Enter the number of walks, hits, and innings pitched into the calculator fields. Click the calculate button to get the WHIP instantly. These tools reduce errors and save time. They work well for quick checks and comparisons.
Common Calculation Errors
One common error is mixing partial innings. Innings pitched should be in decimal form. For example, 4 innings and 2 outs equals 4.2 innings. Another mistake is forgetting to add walks and hits before dividing. Double-check the numbers to avoid errors. Accurate input ensures reliable WHIP results.
Improving Whip In Gameplay
Improving WHIP in gameplay requires focused effort on limiting walks and hits. Pitchers who allow fewer baserunners naturally have a lower WHIP. This section covers practical ways to reduce WHIP through strategy, training, and opponent analysis. Each approach helps pitchers perform better and control the game more effectively.
Pitching Strategies To Lower Whip
Pitchers must focus on control and placement to limit walks. Throwing strikes consistently forces hitters into tough decisions. Mixing pitch types keeps batters off balance and reduces solid contact. Avoiding predictable patterns helps prevent easy hits. Pitchers should also manage pitch counts to maintain sharpness throughout innings. Staying calm under pressure reduces mistakes and free passes.
Training Tips For Pitchers
Daily practice of throwing strikes improves command and confidence. Drills that simulate game pressure build mental toughness. Strength training enhances endurance and pitching velocity. Working with coaches to refine mechanics prevents injury and improves accuracy. Video analysis helps spot weaknesses in delivery and release. Rest and recovery allow pitchers to perform at their best consistently.
Analyzing Opponent Weaknesses
Study hitters’ tendencies to predict their response to pitches. Identify batters who struggle with certain pitch types or locations. Use scouting reports to find weaknesses in swing timing or stance. Adjust pitch selection to exploit these vulnerabilities. Anticipate when to throw fastballs versus breaking balls. Tailoring strategies to opponents reduces hits and walks effectively.

Credit: quotefancy.com
Frequently Asked Questions
Is A 1.00 Whip Good?
A 1. 00 WHIP is considered very good. It means the pitcher allows one baserunner per inning on average. Lower WHIP values indicate better performance.
Is A 0.95 Whip Good?
A 0. 95 WHIP is excellent, indicating a pitcher allows less than one baserunner per inning. This reflects strong performance and control.
What Is Considered A Great Whip?
A great WHIP is typically below 1. 10, indicating a pitcher allows few baserunners per inning. Lower WHIP means stronger performance.
Who Has The Lowest Whip In Mlb History?
Addie Joss holds the lowest career WHIP in MLB history at 0. 9678. His exceptional control limited baserunners per inning pitched.
Conclusion
WHIP shows how many runners a pitcher allows each inning. It adds walks and hits, then divides by innings pitched. A lower WHIP means fewer runners and stronger pitching. This stat helps compare pitchers clearly and quickly. Understanding WHIP can improve how you watch and enjoy baseball.
Keep this simple formula in mind when checking pitcher performance. It makes baseball stats easier to follow for everyone.